When I’m considering a purchase, I typically consult online customer reviews or seek recommendations from friends and family. SaaS product buyers behave similarly. Because of its authenticity and trust-based nature, Word-of-mouth remains the most effective marketing tool for businesses.
To encourage customers to recommend your product, it’s crucial to assess their satisfaction first. While happy customers are invaluable assets, dissatisfied ones can tarnish your reputation and hinder revenue growth. So, how can you gauge customer satisfaction? The answer lies in three words: Net Promoter Score.
A Net Promoter Score (NPS) provides your product team with valuable insights into customer satisfaction and potential churn risks. Calculating NPS is essential for product managers to identify areas for improvement and enhance customer retention.
This guide will walk you through the process of accurately calculating NPS, covering everything from the basic formula to analyzing survey responses and leveraging the data to boost overall customer satisfaction.
Already using NPS to measure customer satisfaction? If not, here’s your quick-start free trial link with ProductFruits. 👈
What’s the Net Promoter Score (NPS)?
Net Promoter Score (NPS) is a metric for customer experience. It begins with an NPS survey that asks, “How likely are you to recommend our business to your friends and colleagues?” Respondents rate their likelihood on a scale from 0 to 10.
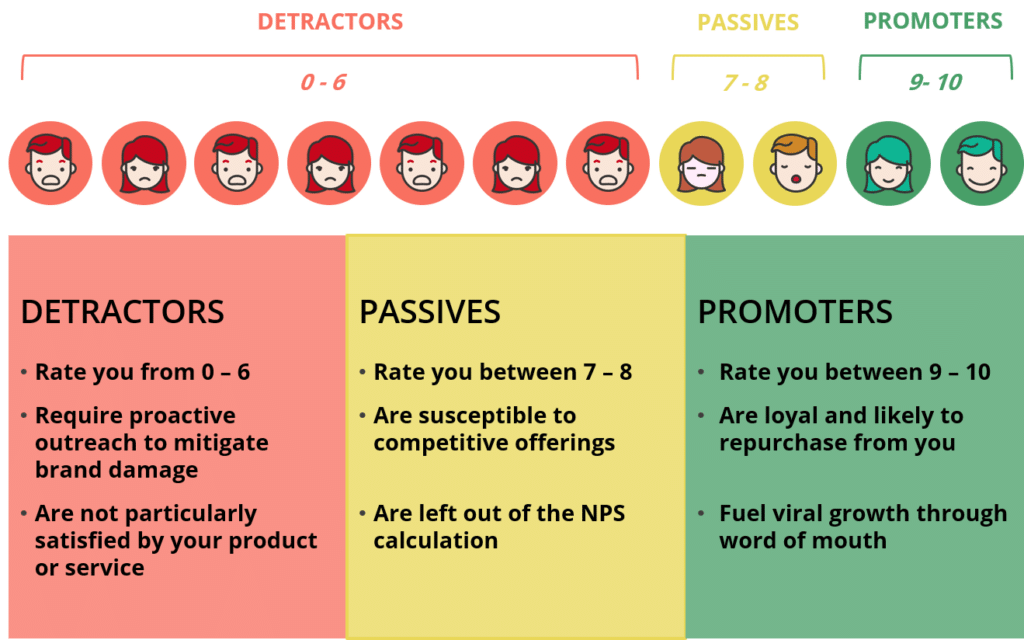
Based on their responses, users are categorized as Promoters (9–10), Passives (7–8), or Detractors (0–6). According to the CustomerGauge NPS Benchmarks report, the average score for the SaaS industry is +36, with the highest score being 92.
The SEO manager at ProductFruits highlights the importance of tracking NPS and how they leverage it in their organization:
“No business can scale beyond a point if they don’t track customer satisfaction metrics. We track NPS every quarter to keep track of the progress we are making, both from a product and service standpoint. The feedback from the detractors helps us shape the product roadmap, and the promoters help us double down on our GTM strategy.”
💡Learn more about why NPS surveys are essential for your business
How to Calculate Net Promoter Score?
Calculating NPS is straightforward, even if you’re not mathematically inclined! Here’s a step-by-step guide on how to calculate NPS:
Step 1: Survey customers by asking, “On a scale of 0–10, how likely are you to recommend our business to a friend or colleague?”
Step 2: Classify the responses into three groups:
- Promoters (9–10) — Loyal enthusiasts who are highly likely to recommend your brand.
- Passives (7–8) — Satisfied but unenthusiastic customers who are less likely to promote.
- Detractors (0–6) — Unsatisfied customers who may spread negative customer feedback.
Step 3: Calculate the percentage of respondents in each category.
Percentage of Promoters: (Number of Promoters ÷ Total Number of Respondents) × 100
Percentage of Detractors: (Number of Detractors ÷ Total Number of Respondents) × 100
Step 4: Apply the NPS calculation formula: NPS = %Promoters – %Detractors
The score ranges from -100 to +100. A positive score indicates you have more promoters than detractors, suggesting higher customer loyalty.

Source: Simplesat
Here’s an example to make this more simple:
Let’s say you surveyed 100 respondents and got the following results:
- Promoters: 50 respondents
- Passives: 30 respondents
- Detractors: 20 respondents
Now we calculate the percentages:
Percentage of Promoters: (50 / 100) × 100 = 50%
Percentage of Detractors: (20 / 100) × 100 = 20%
Compute NPS:
NPS = 50% (Promoters) – 20% (Detractors) = 30
In this example, the NPS is 30, which indicates a generally positive sentiment among customers.
Promoters in NPS score calculation
Promoters are respondents who rate a business 9 or 10 in an NPS survey. These highly satisfied and enthusiastic customers will most likely recommend your brand to others. Promoters are your superpower because they act as brand ambassadors, bringing in referrals through positive word-of-mouth.
To optimize results with promoters, businesses must show appreciation with exclusive offers or perks. Encourage them to provide referrals and testimonials. Ask them for feedback on what you’re doing right. Inviting them to test new products will strengthen their loyalty and increase positive influence on your brand growth. Using their power, your brand can improve decision-making and boost ROI.
Detractors in NPS calculation
NPS Detractors are unhappy customers who score your products or services 6 or below on the NPS survey. They are not your biggest fans and will likely spread negative reviews and discourage others from using your products. They will negatively impact your brand, damaging your reputation and reducing growth.
Addressing detractors is critical as they’re highly likely to churn. You must improve your relationship with them before they choose to leave. You can turn them into promoters by asking them follow-up questions and enhancing their experience.
What are the passives in NPS calculation?
Passives are respondents who rate their likelihood of recommending your brand between 7 and 8. These customers are happy but not enthusiastic, which makes them less likely to promote your brand. They may prefer switching to competitors if a better option arises.
Even though passives don’t actively harm your brand like detractors, they don’t contribute positively either. Addressing their concerns and converting them into promoters can significantly enhance customer loyalty and boost the overall NPS.
3 Actionable Methods to Calculate Net Promoter Score
Now that you know the NPS calculation formula, here are three quick ways to get your overall NPS score:
Calculate your NPS in Excel or Google Sheets
You can calculate your NPS score with Excel or Google Sheets as well. Let’s use an example where we’ve surveyed 10 respondents:
Step 1: Jot down all your responses in the column
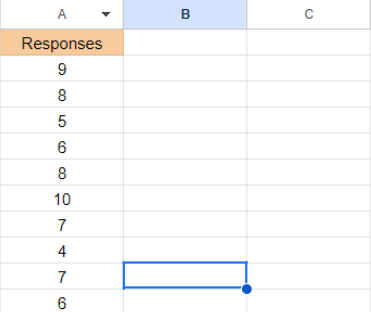
Step 2: Calculate the number of promoters, detractors, and passives. Use the formula “COUNTIF” as follows:
Promoters: =COUNTIF(A2:A11, “>=9”) → 4
Passives: =COUNTIF(A2:A11, “>=7”) – COUNTIF(B2:B11, “>=9”) → 7
Detractors: =COUNTIF(A2:A11, “<=6”) → 3
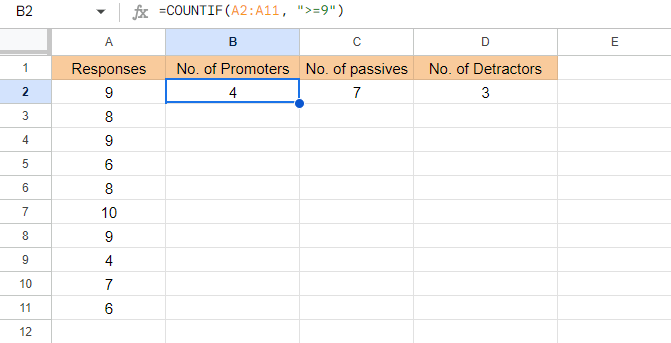
Step 3: Calculate the Percentages with the following formulas:
Total number of responses: =COUNTA(A2:A11)
% Promoters: =COUNTIF(A2:A11, “>=9”)/COUNTA(A2:A11)
% Detractors: =COUNTIF(A2:A11, “<=6”)/COUNTA(A2:A11)
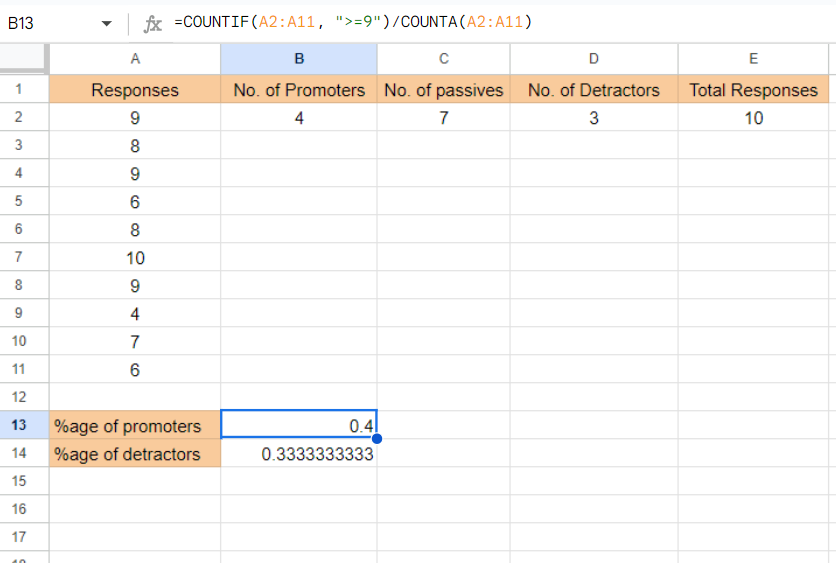
Step 4: Finally, calculate the NPS score by subtracting the percentage of promoters and detractors and multiplying it by 100. In this case, it’d be (0.4 – 0.33) x 100, giving us a score of 7.
Calculate NPS with an NPS calculator
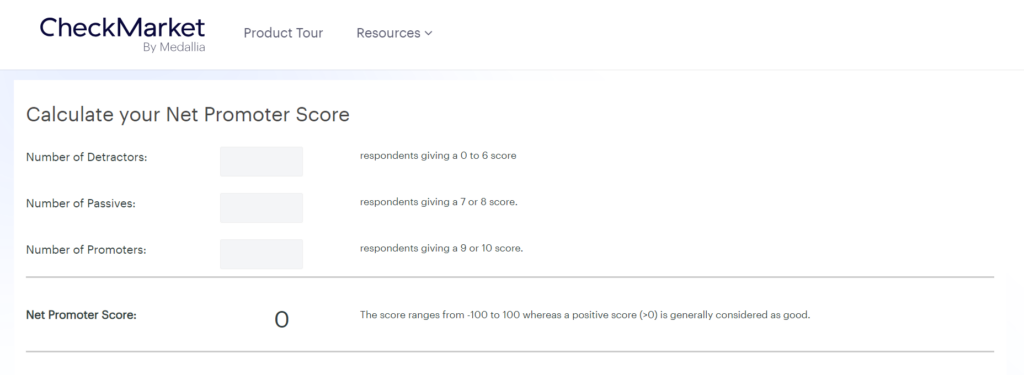
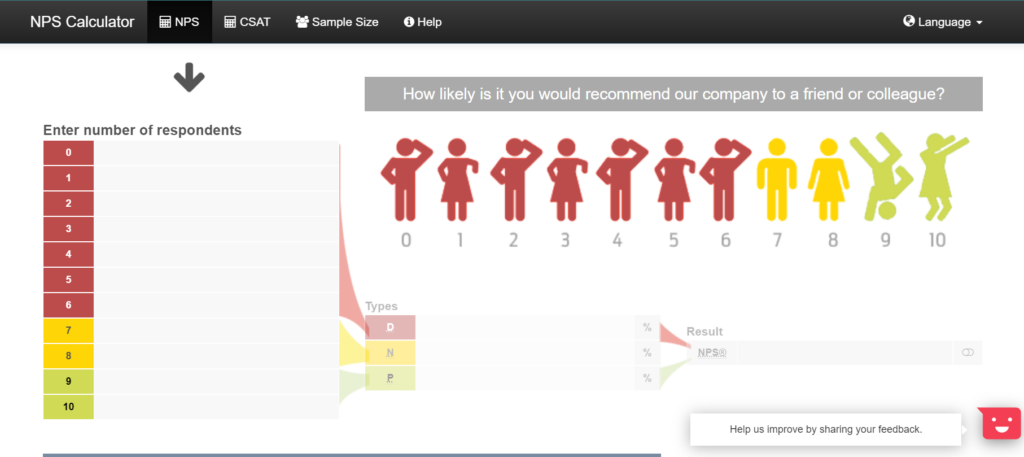
Calculating NPS with an NPS online calculator is a quick process. Once you have conducted an NPS survey and got the results, you must input those into an NPS calculator. The NPS calculator will automatically compute the score by subtracting the Detractors percentage from the Promoters percentage to give you the Net Promoter Score.
Some popular online tools and platforms include:
- CheckMarket
- Npscalculator.com
Product Fruits calculates NPS for you
All the above methods are quick and easy, but if you want to make the most of your NPS surveys and get actionable insights to improve your product, look no further than Product Fruits!
Our tool lets you create customizable in-app NPS surveys, automatically calculates the score, and allows you to track survey performance. Here’s how you do it:
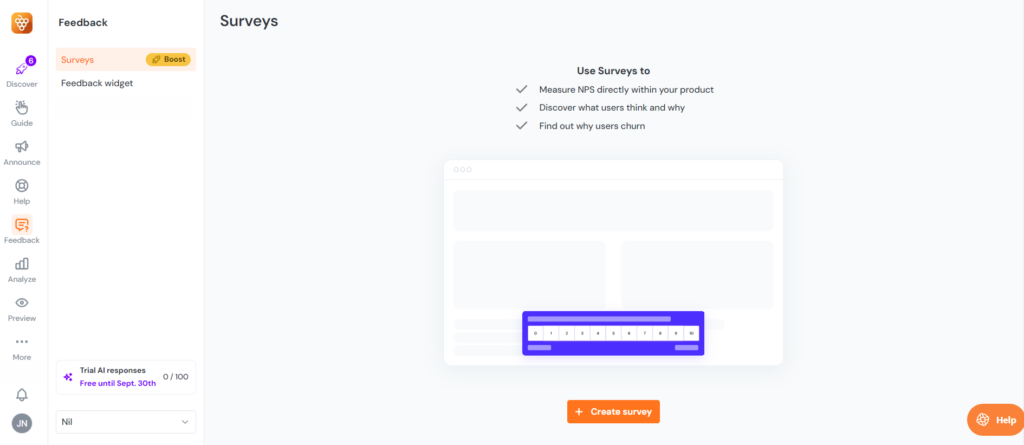
Step 1: On your dashboard, visit “Feedback” and select “Surveys.” Now, click on “Create Survey.”
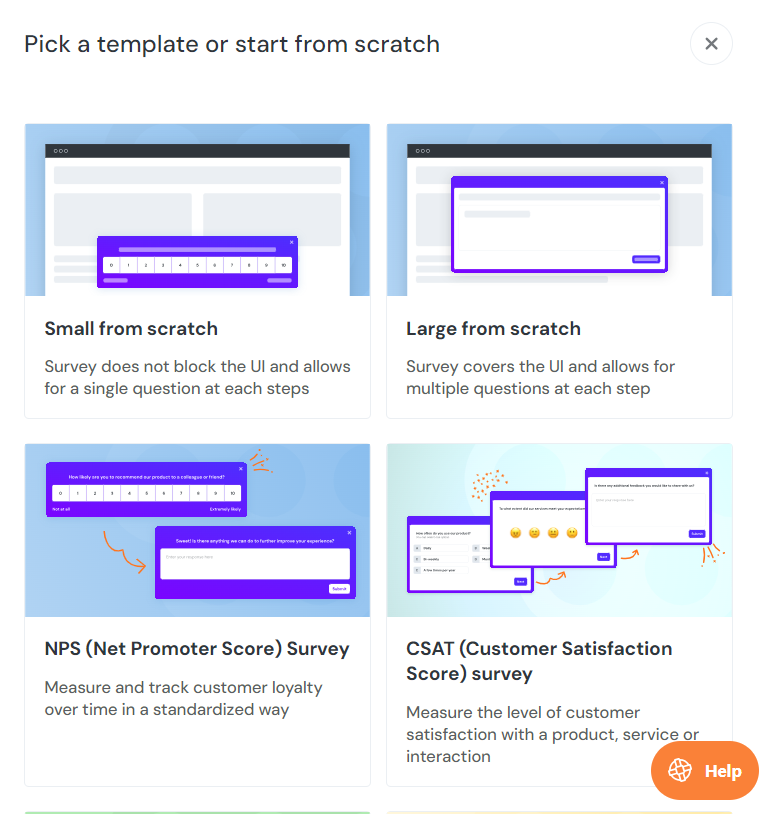
Step 2: You’ll now be presented with a list of different survey templates. Click on “NPS survey.”
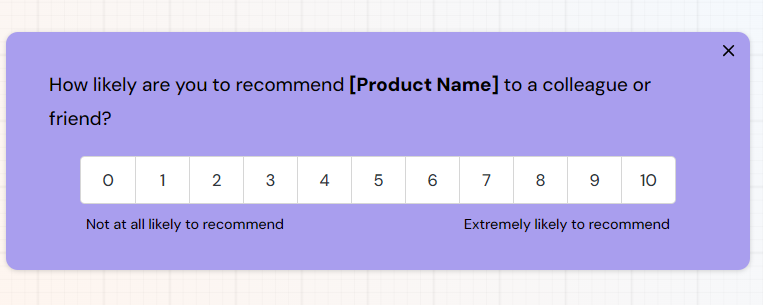
Step 3: Now, you can see what your NPS survey would look like in the product.
You can add any number of questions you like and modify the type of question. For example, using the “multi-line text option” in your surveys gets you more detailed responses from users.
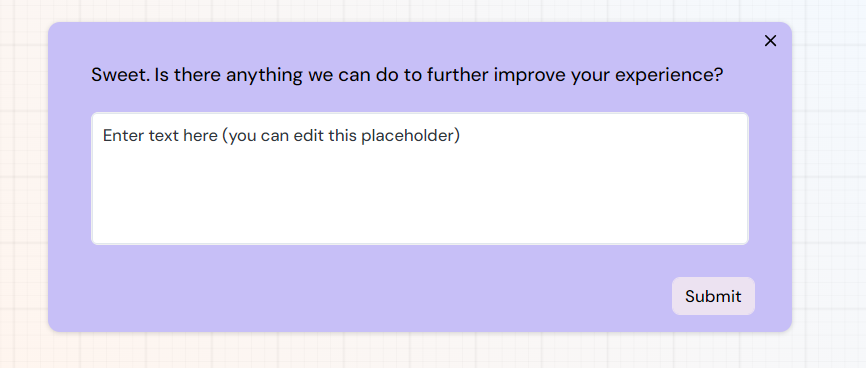
You can also add an end message to users where you thank them for taking the survey.
P.S.: You can also customize how your survey looks based on your brand colors!
Step 4: Once you’ve added your survey questions, you must fine-tune your survey flow by branching the questions appropriately.
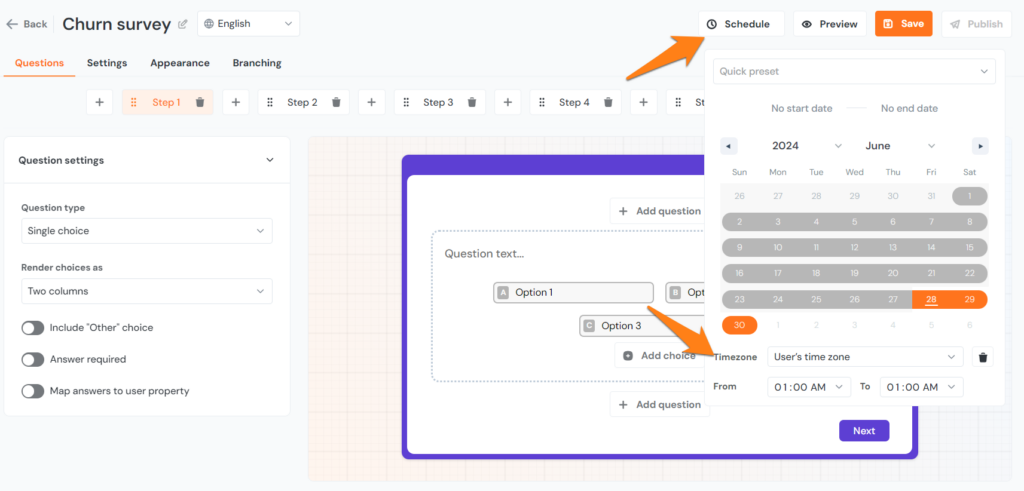
Step 5: Finally, you can publish your survey within your product! You also have the option to schedule your survey like this:
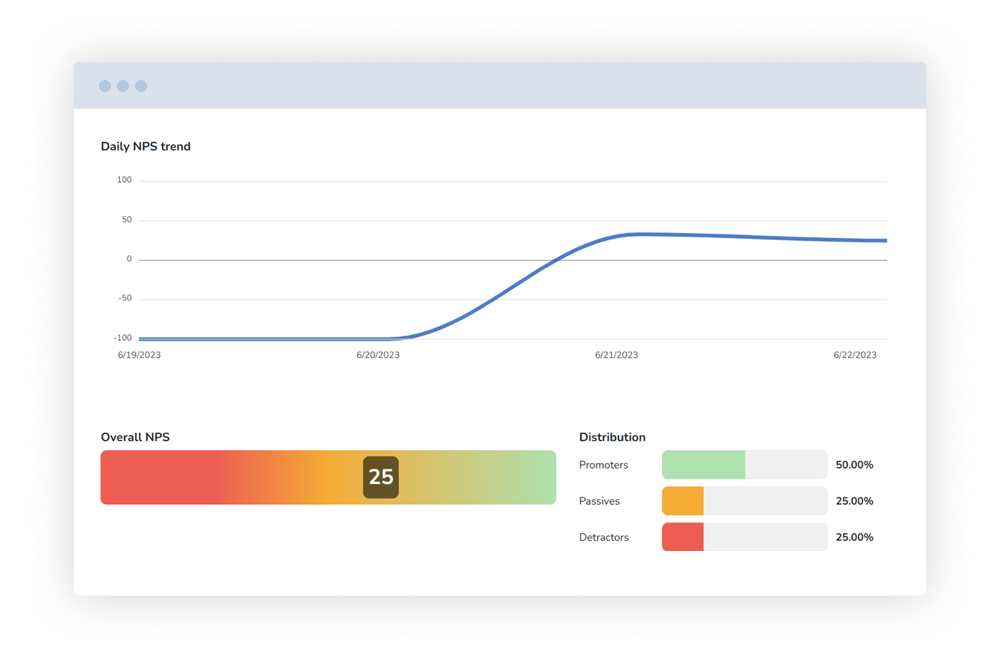
Once you begin getting responses, you can track your survey metrics with a dashboard like this:
How many questions to ask in an NPS survey?
No matter the product or service, one question is always essential in your survey:
“On a scale of 0-10, how likely are you to recommend our product or service to a friend or colleague?”
Once they select a score, you can further support your NPS survey with follow-up questions. This will help you determine the reasoning behind their rating and offer actionable insights.
What follow-up questions to ask in an NPS survey?
Follow-up NPS questions help gather more profound insights into customer experiences. Here are a few questions to ask based on the score given by them:
For NPS Promoters:
We are happy that you would recommend us to your friends and colleagues. “What specific features or services made you give this score?” “How can we continue to improve or exceed your expectations?”
Source: ProductFruits
For NPS Passives:
“What could we do to improve your experience and earn a higher score?”
For NPS Detractors:
Our apologies for not meeting your requirements. “What was the primary reason for the low score?” How can we improve your experience in the future?” “What would make you recommend our brand to others?”
Relationship vs. transactional NPS survey
A Relationship NPS Survey measures customer loyalty and satisfaction over time, focusing on the overall customer relationship with the brand. These surveys are typically conducted regularly to track long-term trends and customer sentiment.
In contrast, a Transactional NPS Survey measures customer satisfaction immediately after specific interactions, such as a purchase or customer service experience. These surveys provide context-specific feedback for real-time improvement.
Key differences:
- Relationship NPS is periodic, while Transactional NPS is immediate.
- Relationship NPS reflects overall loyalty, while Transactional NPS focuses on specific experiences.
- Relationship NPS helps track long-term trends, while Transactional NPS identifies immediate issues.
How many respondents should you survey for NPS?
To accurately represent your customer base, aim for a sample size large enough to yield reliable results. While there’s no universal number, start with at least 100 survey respondents. For more precise estimates, consider targeting 300–500 respondents—this can provide more dependable insights and minimize the margin of error. The ideal sample size ultimately depends on your overall customer base and desired confidence level in the results.
💡Find out how you can optimize your surveys to get maximum number of responses
Key Takeaways
NPS isn’t just a number—it’s crucial for boosting customer loyalty and building stronger relationships. You can proactively address potential issues and satisfy your customers by analyzing your NPS data. Why guess how your customers feel when you can ask them directly? Explore ProductFruits’ in-app surveys to swiftly gather and act on NPS results, enhancing your customer experience.
Book a demo or start a 14-day free trial to see how ProductFruits 🍇 can help you boost your NPS score and exceed customer expectations.

